
Per-team and per-department cost breakdowns
Kubernetes doesn't attribute costs to teams or departments. Cluster-wide billing makes it hard to tell which team is driving spend and where optimization should focus.
Kubeadapt now groups costs by team and department, with assignment via Kubernetes labels or manual mapping.
Two ways to set it up
Kubernetes labels (automatic)
If your workloads already carry team and department labels, the agent reads them from deployments, statefulsets, and daemonsets and groups costs accordingly. No manual mapping needed.
Assign from the dashboard (no rollouts needed)
Teams and departments can also be created and assigned directly from the UI — no need to redeploy workloads or add labels to manifests. Both approaches work together: labels handle workloads that already have them, and you assign the rest from the dashboard.
What you get
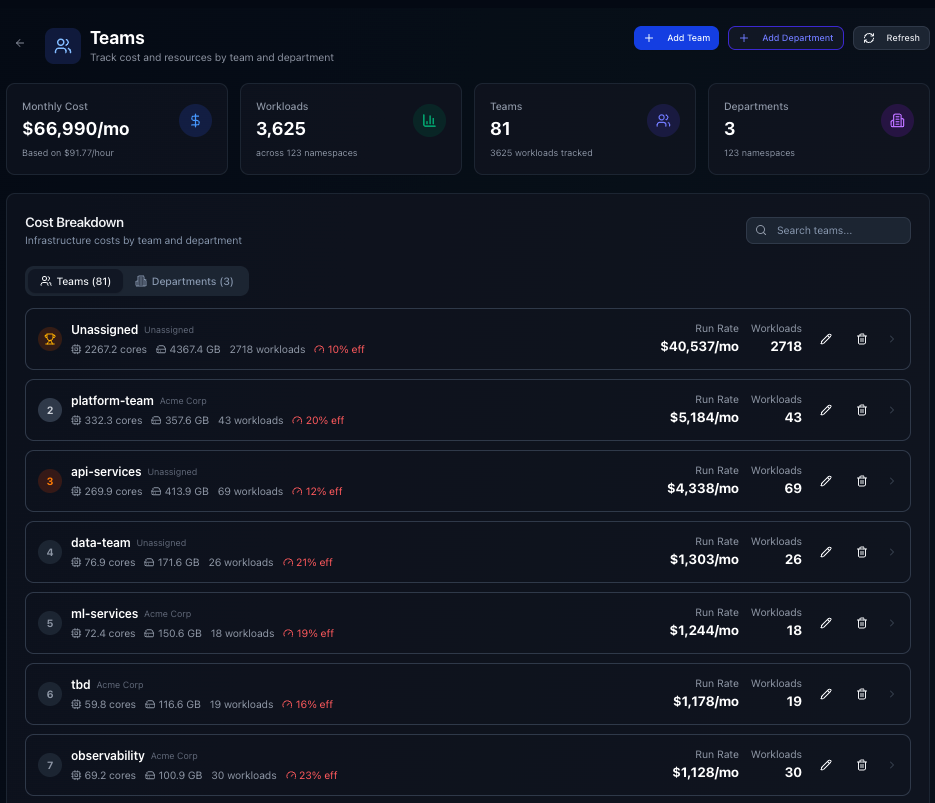
Per-team cost cards show monthly run rate, CPU/memory usage, workload count, and efficiency percentage. Teams are ranked by spend so the biggest cost drivers are visible immediately.
Department rollups group teams under departments. Expand any department to see which teams fall under it and how costs distribute.
Cost Explorer integration: the Cost Explorer has a dedicated Teams & Departments tab. Filter queries by team or department, and save scoped dashboards to share with team leads.
Detail pages let you drill into any team or department to see assigned namespaces, workloads, and cost trends over time.
How it works
The hierarchy: Department > Team > Namespace > Workload. When the agent sends cluster data, the backend calculates resource costs per namespace, then rolls them up into team and department totals. Costs cover CPU, memory, GPU, and storage based on actual usage.
Getting started
Go to Dashboard > Teams. If your workloads have labels, teams will already be populated. Otherwise, click "Add Team" or "Add Department" to build your org structure manually. For more on how costs are calculated and split, see Cost Attribution.